DYNMECH CYCLEVIEW · FREE
One CSV becomes a playing timing chart.
Fill in a CSV, hit space, export it into the bid. Try it in your browser or download the desktop app — two editions, one engine, both free.
WINDOWS · MACOS — NO SIGN-UP · NO LICENSE KEY · FULLY OFFLINE
How is your machine’s cycle time estimated today?
WITHOUT CYCLEVIEW
- A hand-drawn Gantt chart in Excel — change one parameter and re-layout the whole sheet
- At the bid review you point at a screenshot and say “this takes about two seconds”
- Timing knowledge lives in PLC comments, spreadsheets and a senior engineer’s head
- The chart you email can’t be played, searched or trusted
WITH CYCLEVIEW
- Five CSV columns are the entire input; edits recalculate the chart instantly
- A frame-accurate MP4 and a millisecond-precise PDF go straight into the bid
- The CSV is a version-controllable timing document; projects save as .cvp files
- The PDF is vector, searchable and opens for anyone — no software needed
FOLLOW PLAYBACK · F
Modules 85 cells apart, still in one frame
Two heads working out of phase: head down, pick, head up, jog — four stations in a row; then the long move to the top camera, four-sided inspection, place, and back to the pick position. 72 actions, one keypress to play.
- Tracks every module that is drawing right now, not just one mechanism
- Only zooms out from where you are; returns to your level once the action narrows
- Hard backstop: a cell that slips past the edge is pulled back the same frame
FIVE COLUMNS = ONE MACHINE
If you can fill a spreadsheet, you can chart a machine
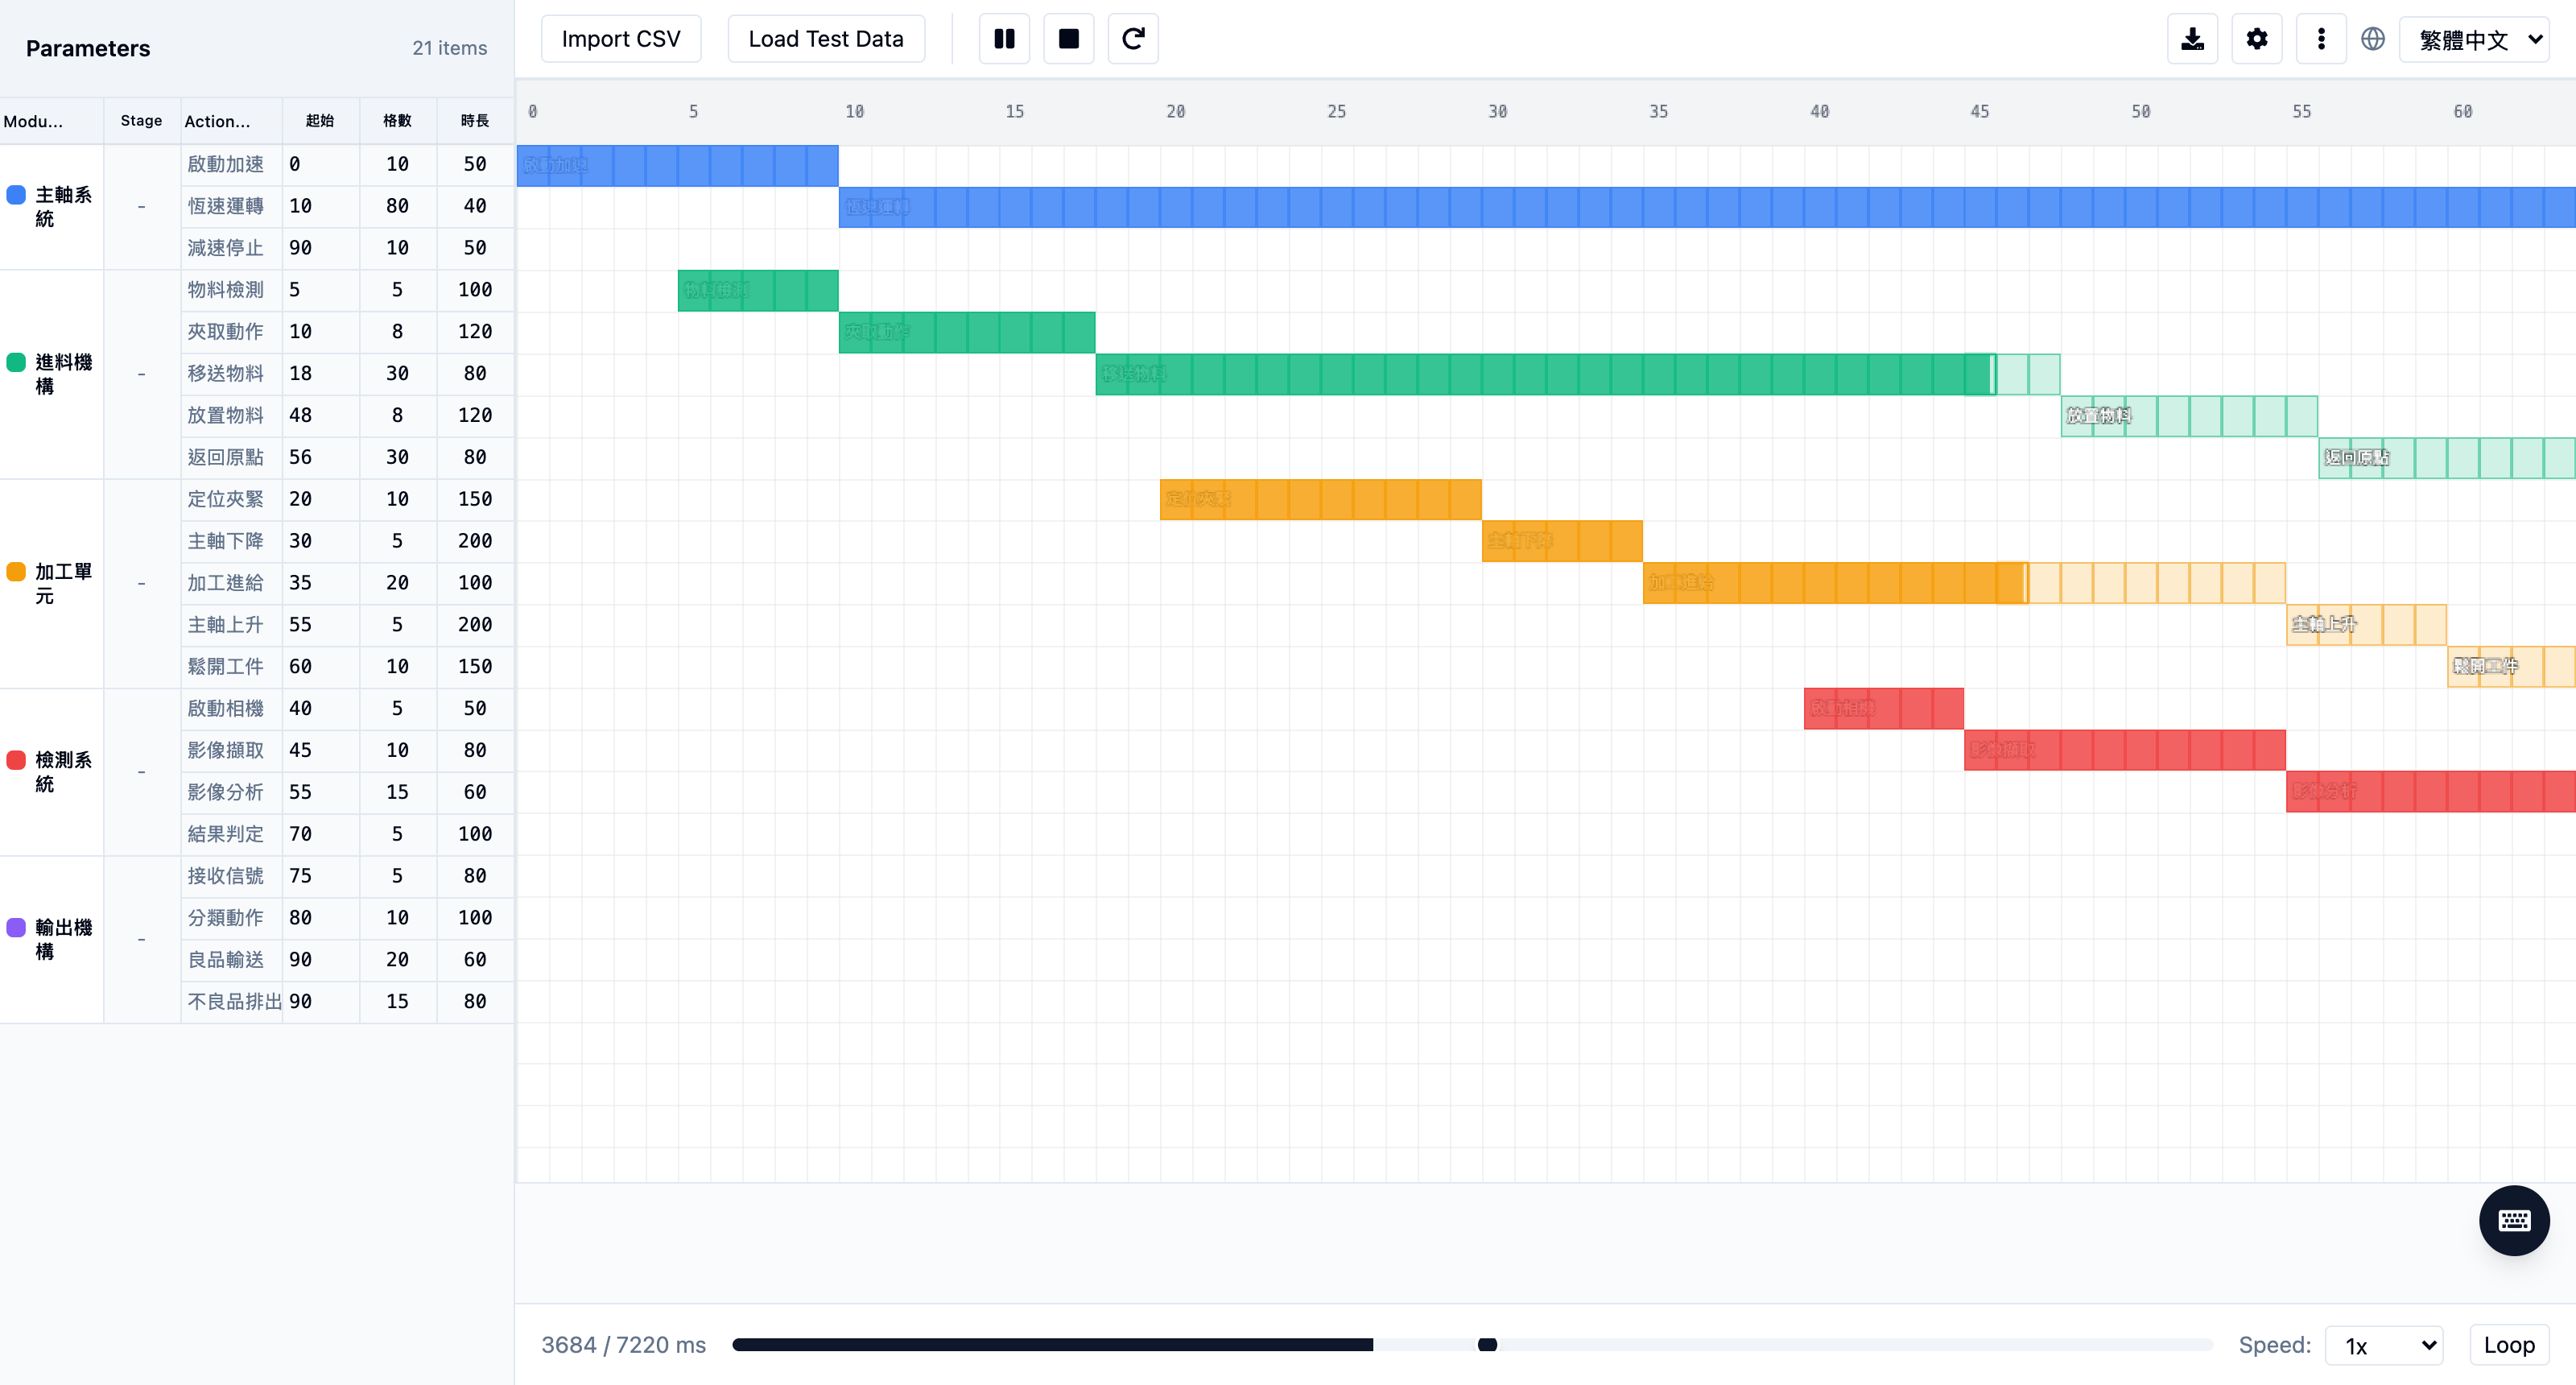
module, action, start position, move count, duration — five columns describe every mechanism. Serial actions on the same module schedule themselves automatically, one after another.
- Drag-and-drop CSV import with row-level validation and clear error messages
- 10 bundled example scenarios: assembly station, packaging line, robot arm and more
WHAT-IF IN REAL TIME
Change a number, watch the cycle shrink
Double-click any cell in the parameter table, change 100 ms to 60 ms, and the chart and total cycle time update instantly. Ctrl+Z takes you back.
FIVE LANGUAGES
An interface your whole supply chain reads
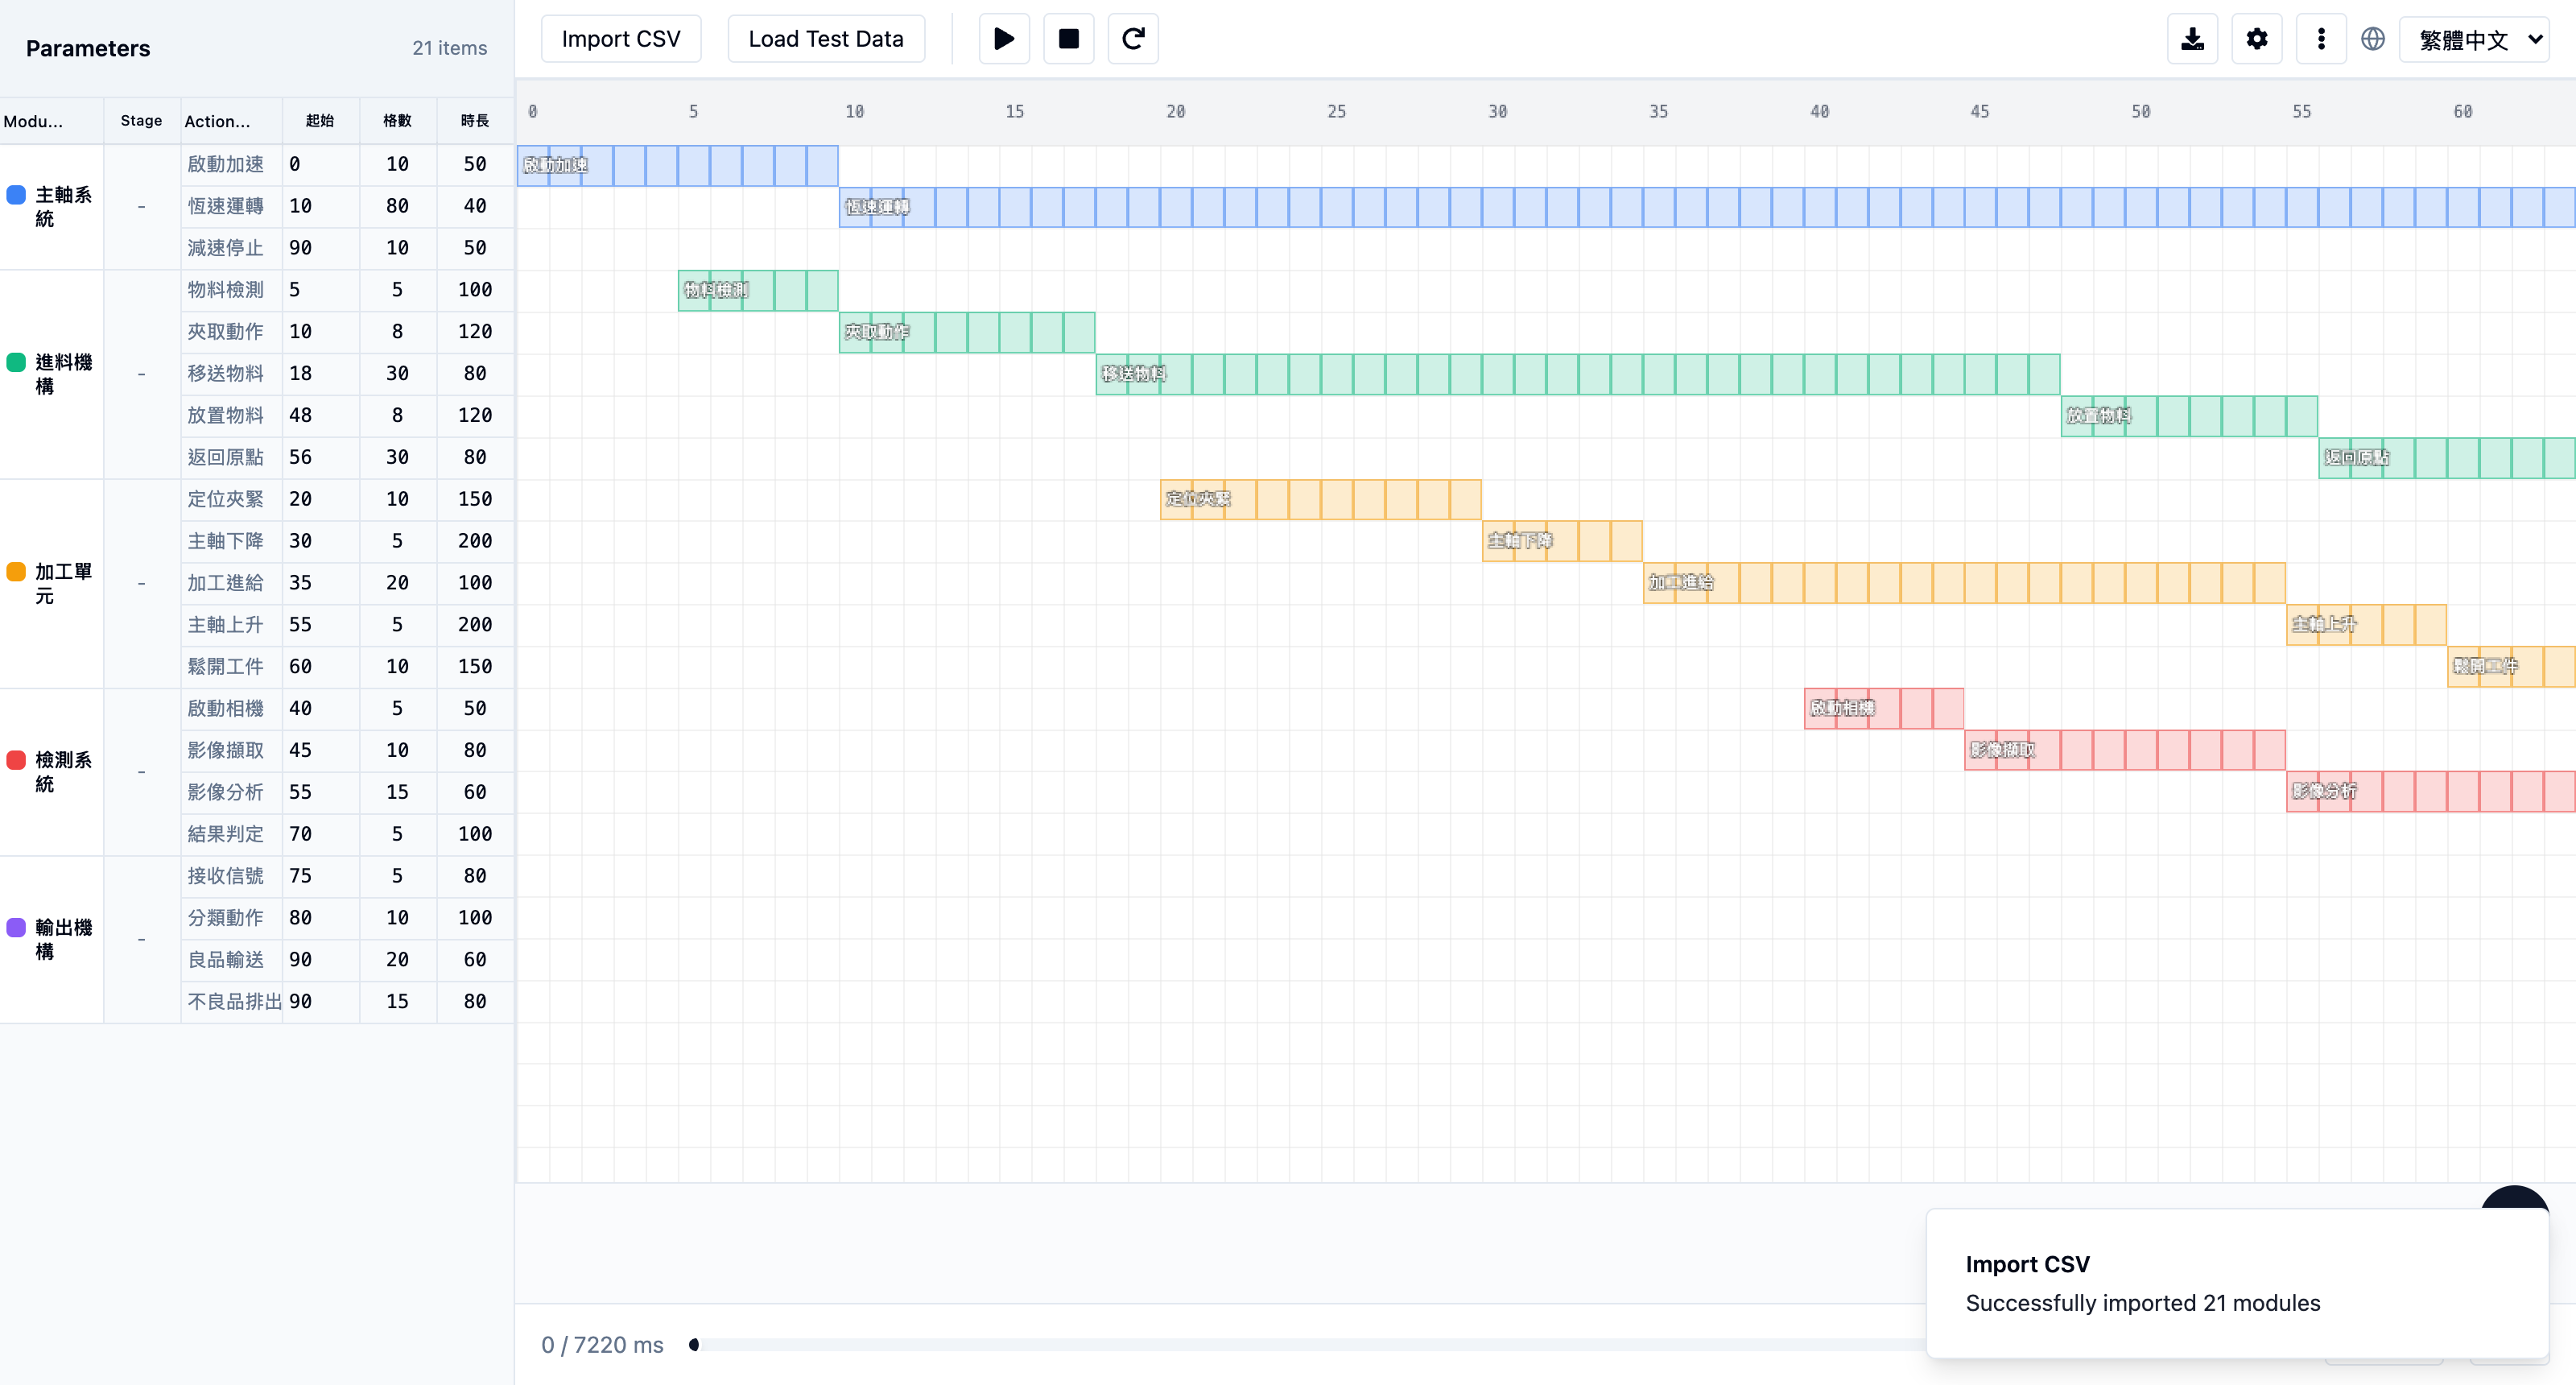
Traditional Chinese, Simplified Chinese, English, Japanese and Korean — the full UI, the native menus, and the PDF report too.
Two ways to use it, one engine
Want a quick look, or to send a chart to a colleague? Use the online edition. Doing real project work and exporting into a bid? Download the desktop app. Both are free.
Open the page and the full visualization engine is there. No install, no sign-up, no license key.
- 8 real production-line samples built in — one click and it moves
- Share link: the whole CSV packs into the URL, your colleague just opens it
- Follow playback, variable speed, frame stepping and zoom all included
- Up to 100 rows; read-only preview, no exports
The one for real project work. Runs fully offline, no row limit, every export.
- Frame-accurate MP4 at 720p/1080p/1440p, recording follow playback
- A3 searchable vector PDF report with computed start and end times
- Edit the parameter table with undo/redo, no row limit
- Windows and macOS; the portable Windows build needs no installation
Full comparison
| Feature | Online edition | Desktop edition |
|---|---|---|
| Getting started | Open a page | Download and install |
| CSV import and chart rendering | ✓ | ✓ |
| Play / speed / frame step / loop | ✓ | ✓ |
| Follow playback | ✓ | ✓ |
| Zoom, fit to window, crosshair | ✓ | ✓ |
| Five UI languages | ✓ | ✓ |
| Built-in sample library | ONLINE ONLY | — |
| Share link | ONLINE ONLY | — |
| CSV rows | Up to 100 | Unlimited |
| Table editing, undo / redo | — | ✓ |
| MP4 / PDF / CSV export | — | ✓ |
| Data uploaded to a server | No | No |
| Price | Free | Free |
The online edition is a deliberate subset — exports are what the free desktop app is for. Both editions run the same rendering engine, so what you see online is what the desktop app exports.
Capabilities at a glance
module · action · start · count · interval — that is the whole format.
Actions on the same mechanism chain end-to-start by themselves.
Every frame re-rendered at its exact millisecond — never a screen recording.
A3 chart plus computed start/end times; sharp at any zoom.
Double-click a cell; chart and total cycle recalc instantly.
繁體中文 · 简体中文 · English · 日本語, PDF report included.
Zero network requests, zero telemetry — in the EULA, in writing.
Runs without installation inside restricted factory networks.
Design scope
CycleView handles the time dimension only. No overlap on the timing chart does not mean mechanisms cannot collide in space — CycleView does no geometric interference checking, no kinematics and no dynamics. For the spatial question, hand your timing over to DynMech Motion. See DynMech Motion →
Download DynMech CycleView
Free for commercial use. The portable Windows build runs inside restricted factory networks without installation.
Support is community-based via GitHub Issues.
Frequently asked questions
Is DynMech CycleView really free?
Yes — free forever, including commercial use. No license key, no registration, no trial countdown, and the installer may be redistributed inside your company. It is fully offline: the app makes zero network requests and collects zero telemetry.
What input does CycleView need?
One CSV with five columns — module, action, start position, move count, duration — plus an optional stage column for grouping. Ten sample CSVs ship with the app, and the legacy intervalTime header still imports.
How is the MP4 export different from screen recording?
CycleView re-renders every frame offscreen at its exact millisecond offset using the same renderer as the on-screen chart, so the video is frame-accurate and its length depends only on the data — not on your computer’s speed.
Does CycleView check for collisions?
No. CycleView analyses timing only — it does no geometric interference checking. Absence of overlap on the chart does not guarantee mechanisms cannot collide in space. Use DynMech Motion for 3D motion verification.
Which platforms are supported?
Windows (installer and a portable no-install build) and macOS (Apple Silicon and Intel).
What is the difference between the online and desktop editions?
They run the same engine. The online edition works in your browser with no install — sample charts, share links, follow playback, up to 100 rows, read-only. The desktop edition is the one for real project work: unlimited rows, table editing with undo, and MP4, PDF and CSV export. Both are free.
Does the online edition queue at busy times?
No. The chart renders in your browser and the server only sends the page, so there is nothing to queue for — no accounts, no time limits, and no slowdown however many people use it at once.
Does the online edition upload my CSV?
No. Your file is parsed and drawn locally; the app makes no upload requests. Share links compress the data into the part of the URL after “#”, which browsers never send to a server — but anyone holding that link can read the chart, so treat a share link like the file itself.
Can I use it for production line balancing?
Yes — put each station’s mechanisms in one chart, play it, and idle time and overlaps become visible immediately. The stage column groups actions by process step.